Benchmarking Service Efficiency

Activity & Costing Benchmarking
With more than 95 hospitals that care for children participating in our Benchmarking Program, we are able to provide benchmarks with paediatric services of similar size and capability to your own. Whether you are leading a tertiary children’s hospital, or the paediatric ward of a rural hospital, you will find meaningful comparators in our reports.
Our Reports draw upon de-identified data about the care provided to every child at your service, including in the Emergency Department, in an Outpatient Clinic and/or in an admitted bed. They help to identify comparative results for children at your service compared with peer services seeing similar children in terms of:
- comparative levels of demand for care across the different diagnosis groups,
- duration of stay by diagnosis and complexity,
- the profile of long stay patients
- urgent readmissions
- planned versus emergency workloads
- average costs for children’s care by diagnosis, bed days and/or complexity
- trends in these variables over time – are things improving over time or becoming even more challenging?
In addition to detailed information about all the major diagnosis groups of children, our reports provide summary analysis to help busy service leaders identify where to focus their time and attention. Budget managers can focus on the list of top diagnosis groups for which the average costs of care are markedly higher than peers seeing similar children. We provide both summary analysis and detailed breakdown of cost allocations and outliers to enable you to identify the drivers behind any result which is at odds with peer services.
Clinical leaders may wish to focus on variations in average length or stay, readmission rates or the children presenting to their service multiple times each year. The reports include valuable information about differences in the use of procedures for relevant diagnoses as well as breakdowns on the relative inputs of staff from different professional disciplines to the care of children with a common diagnosis. These data provide a useful starting point for local discussions about the drivers behind observed variation and any opportunities for enhancing the care being provided.
CHA brings insights from our Benchmarking data into many of the discussions member are having through our networking groups. And we assist staff to connect with relevant peers on common challenges as well as to access information about innovations others have found helpful for enhancing the efficiency and effectiveness of their children’s service.
These data are provided quarterly to tertiary paediatric services and annually to paediatric units.
To access your service’s report log in to the online member’s community and visit the Benchmarking pages.

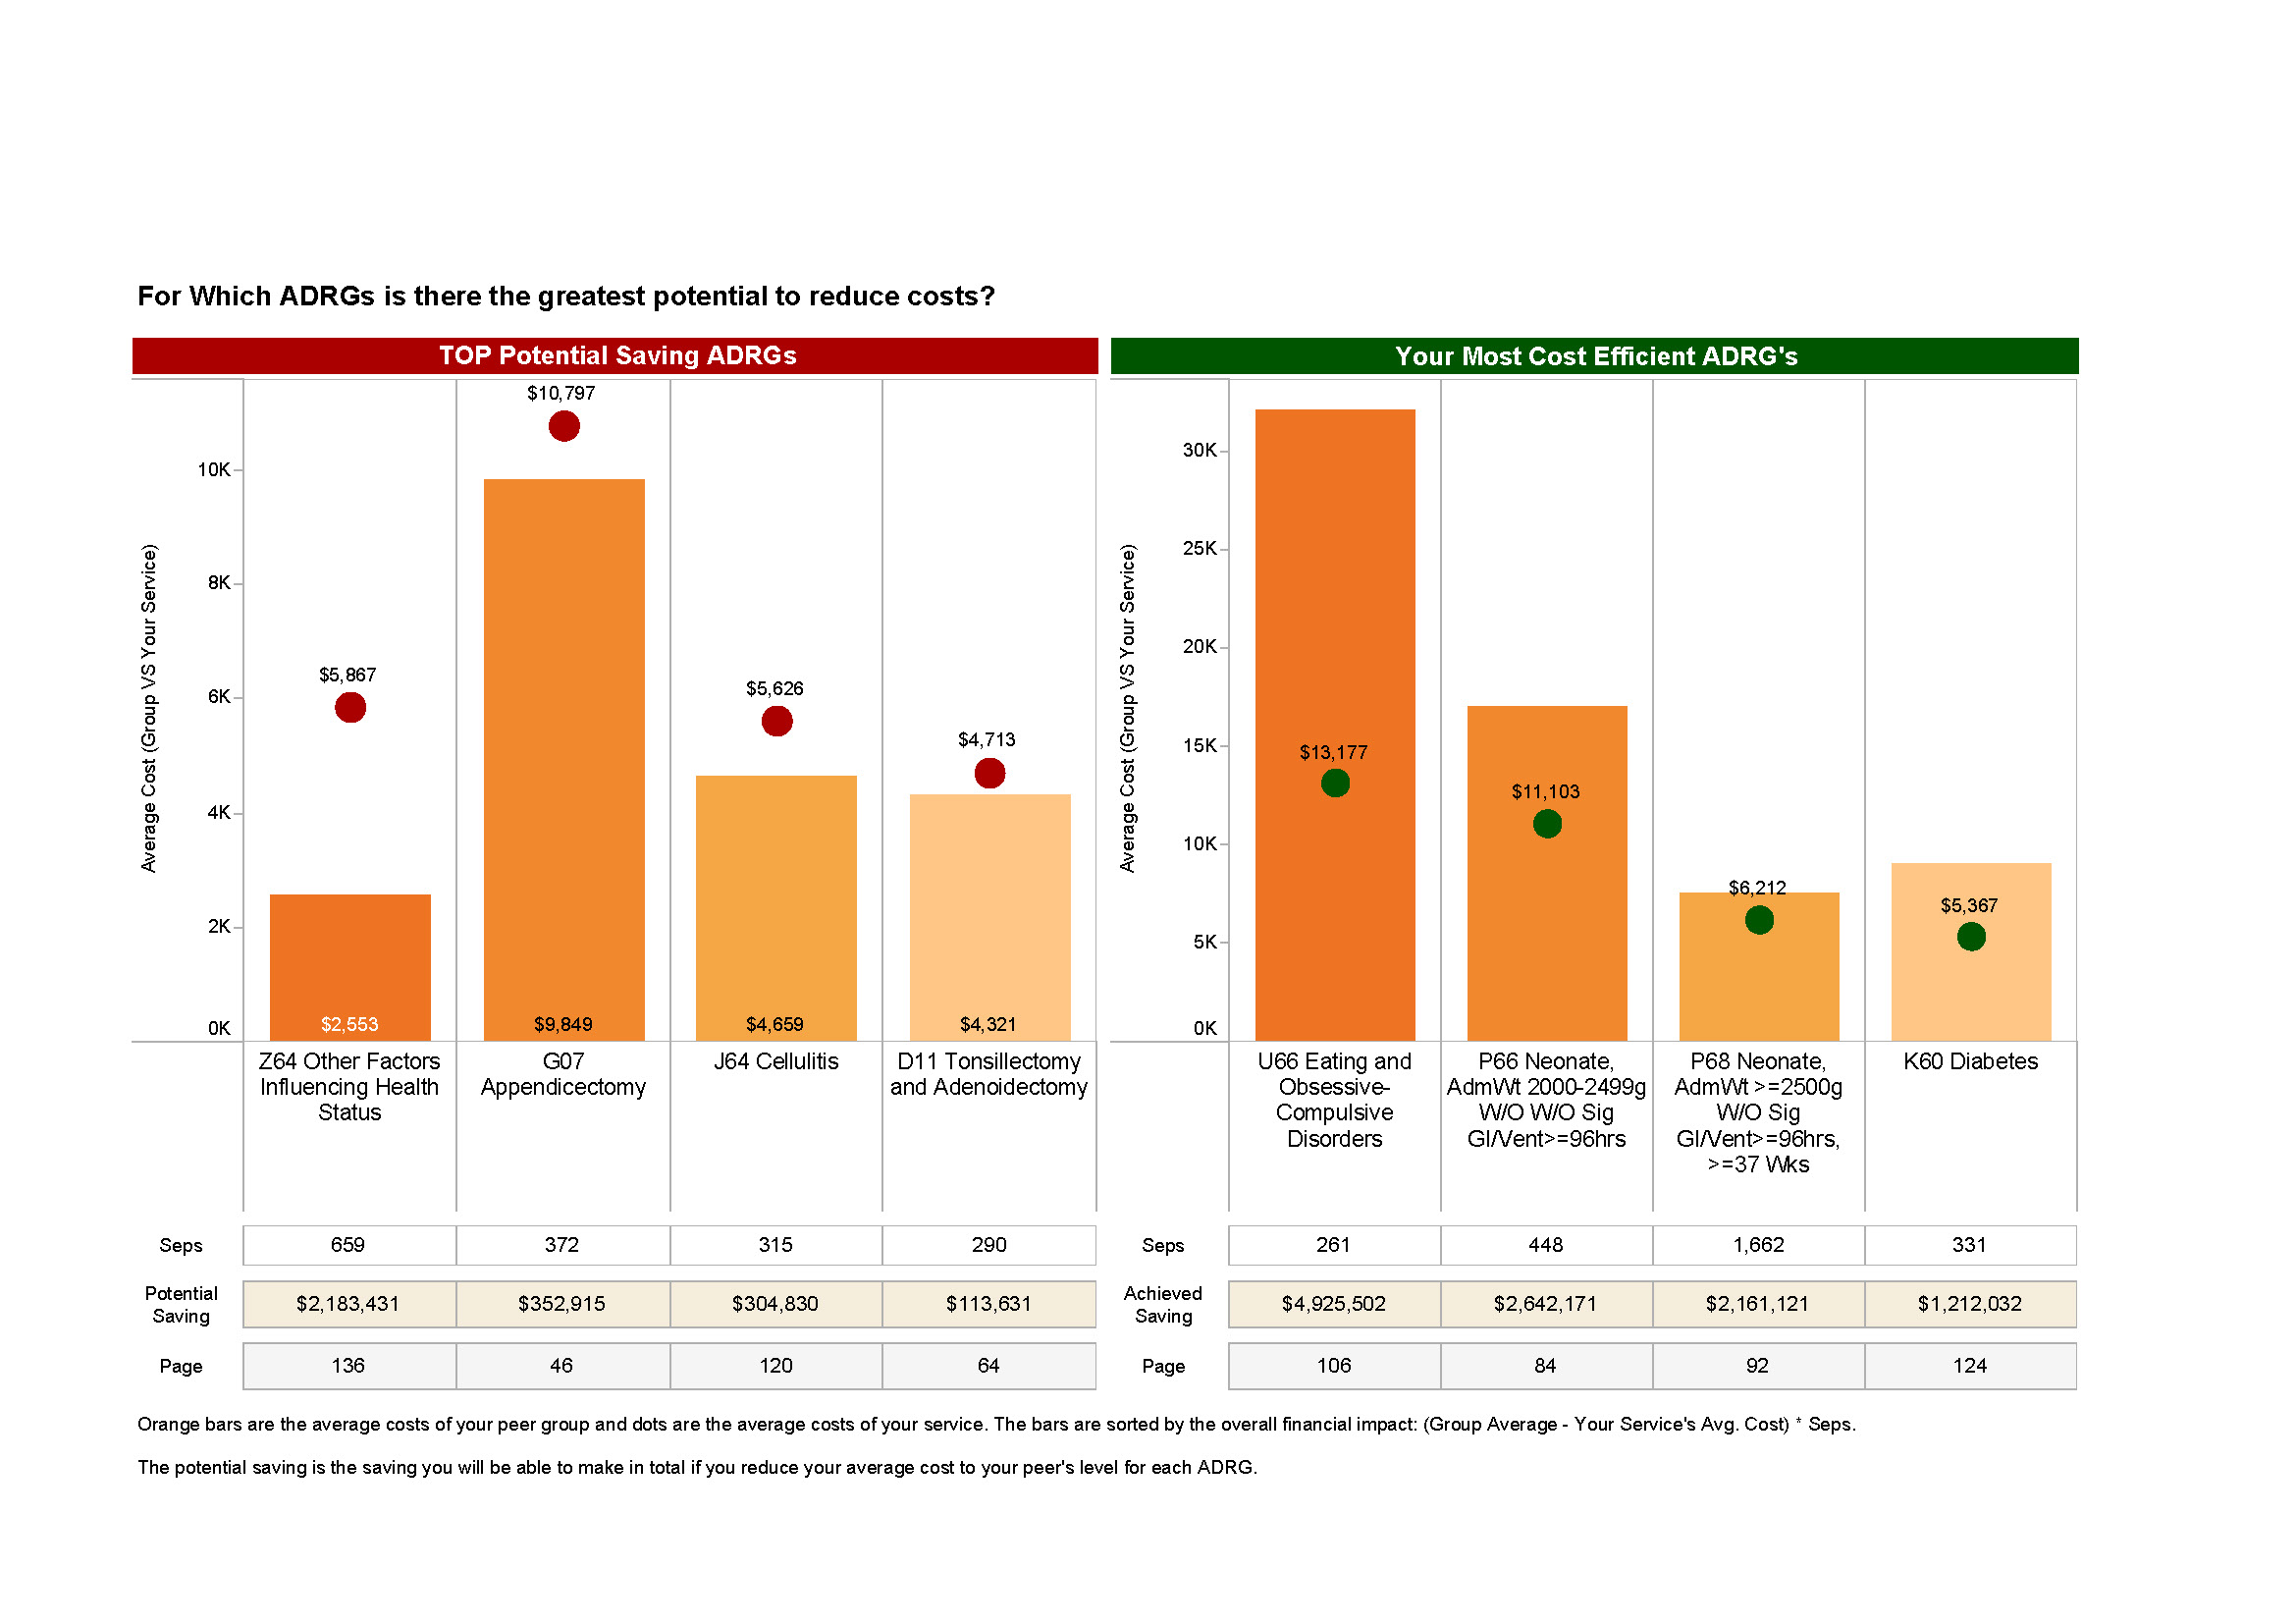
CHA helps you target potential cost savings for high volume diagnosis groups of children at your service. You can see at a glance the areas of potential for efficiency savings in comparison to your peers caring for similar children.

CHA helps you target potential cost savings for high volume diagnosis groups of children at your service. You can see at a glance the areas of potential for efficiency savings in comparison to your peers caring for similar children.

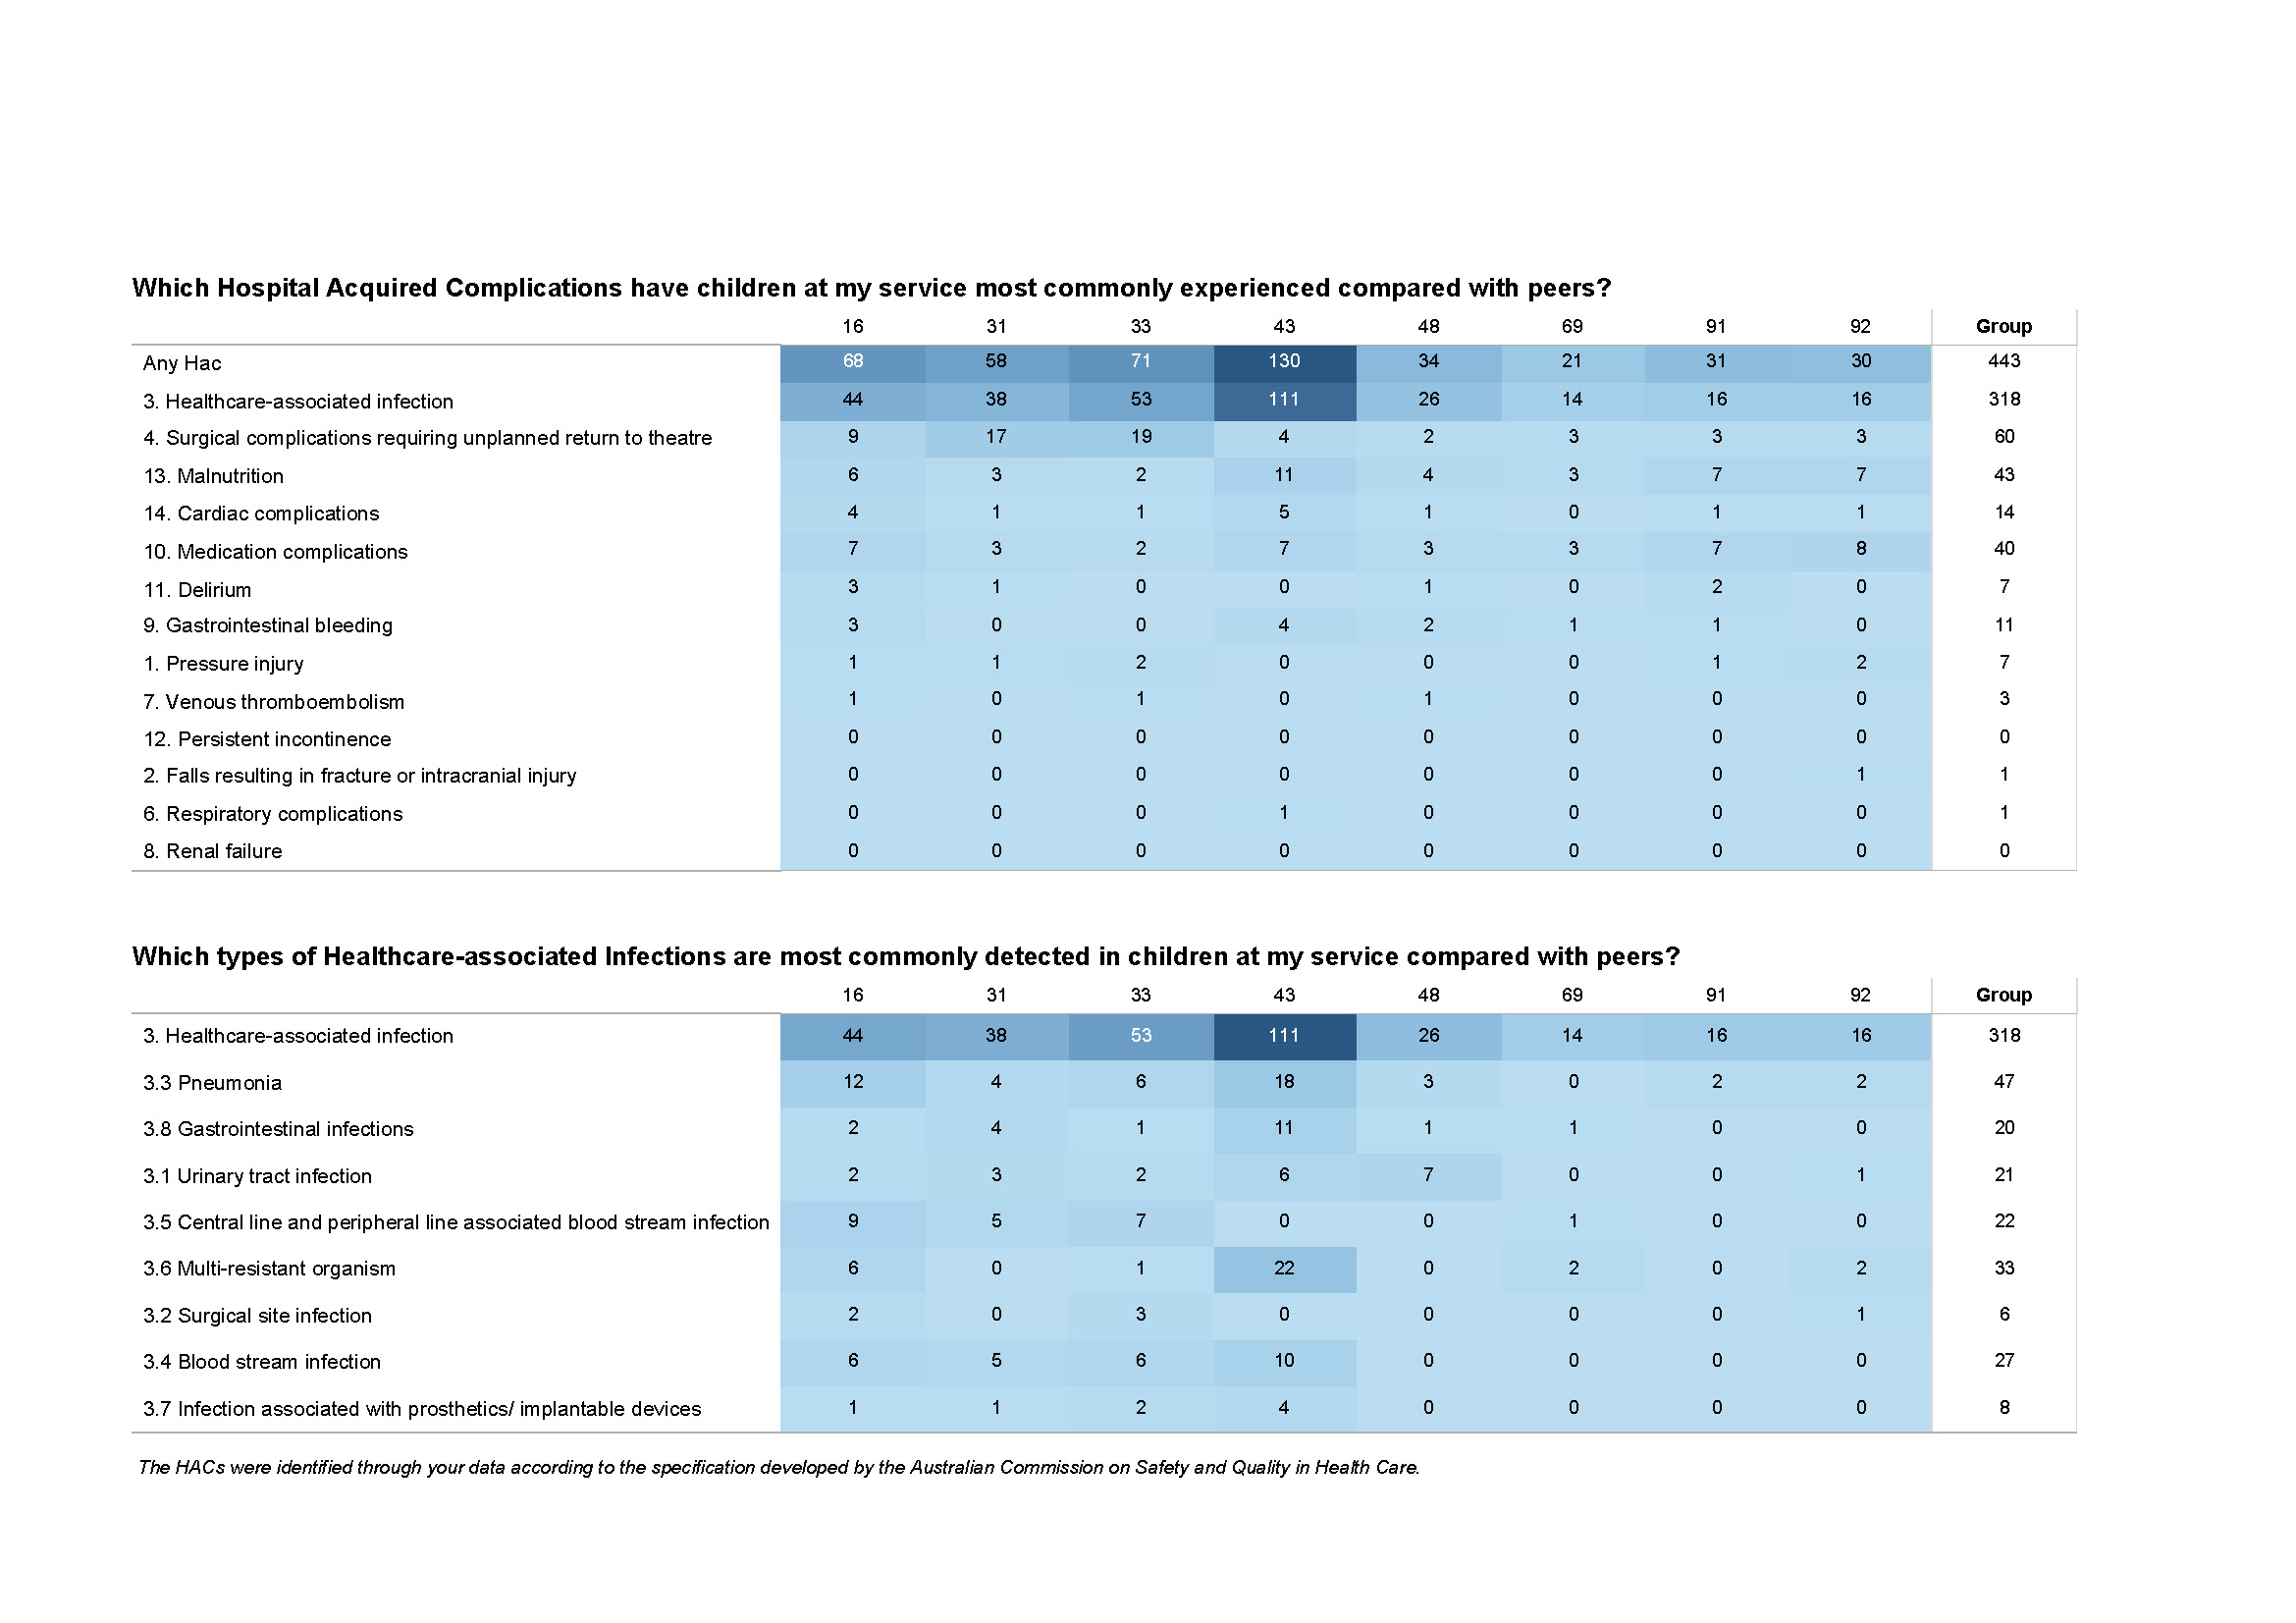
CHA has collected all diagnosis and procedures (ICD level data) for Inpatients from all CHA members. This enables analysis of variations in care as well as comparative rates of Hospital-Acquired Complications (HAC).

CHA has collected all diagnosis and procedures (ICD level data) for Inpatients from all CHA members. This enables analysis of variations in care as well as comparative rates of Hospital-Acquired Complications (HAC).

